

Data Plotter - collect the data from one or multiple devices and monitor them via your browser
Collect the data from one or multiple devices and monitor your devices via your browser.
What is Data Plotter ?Copy permalink to clipboard
The BromleySat Data Plotter is designed to serve a similar function to Arduino IDE’s Serial Plotter. It is useful in cases where you are using VS Code with Platform IO or if your IoT device is not connected to anything other than power supply while still accessible via your local network. You can collect the data from one or multiple devices and monitor your devices via your browser.
Regular releases with zero changes required on any of the connected devicesCopy permalink to clipboard
There are several ways that you can deploy a web application that can run directly on your device, but it involves saving a lot of files on your device and makes it harder to update. Our approach is to download the full website from our publicly available site and then use that to display device data. This way we can keep improving the website and make regular releases with zero changes required on any of the connected devices.
PrerequisitesCopy permalink to clipboard
You will need to ensure that your device has two endpoints:
Config endpoint: /api/config
{
    "deviceId": "Data Plotter Example"
}
Data endpoint: /api/data
{
"Voltage": -115,
"Temperature": 10,
"WaterLevel": 25,
"RelayIsOn": 0
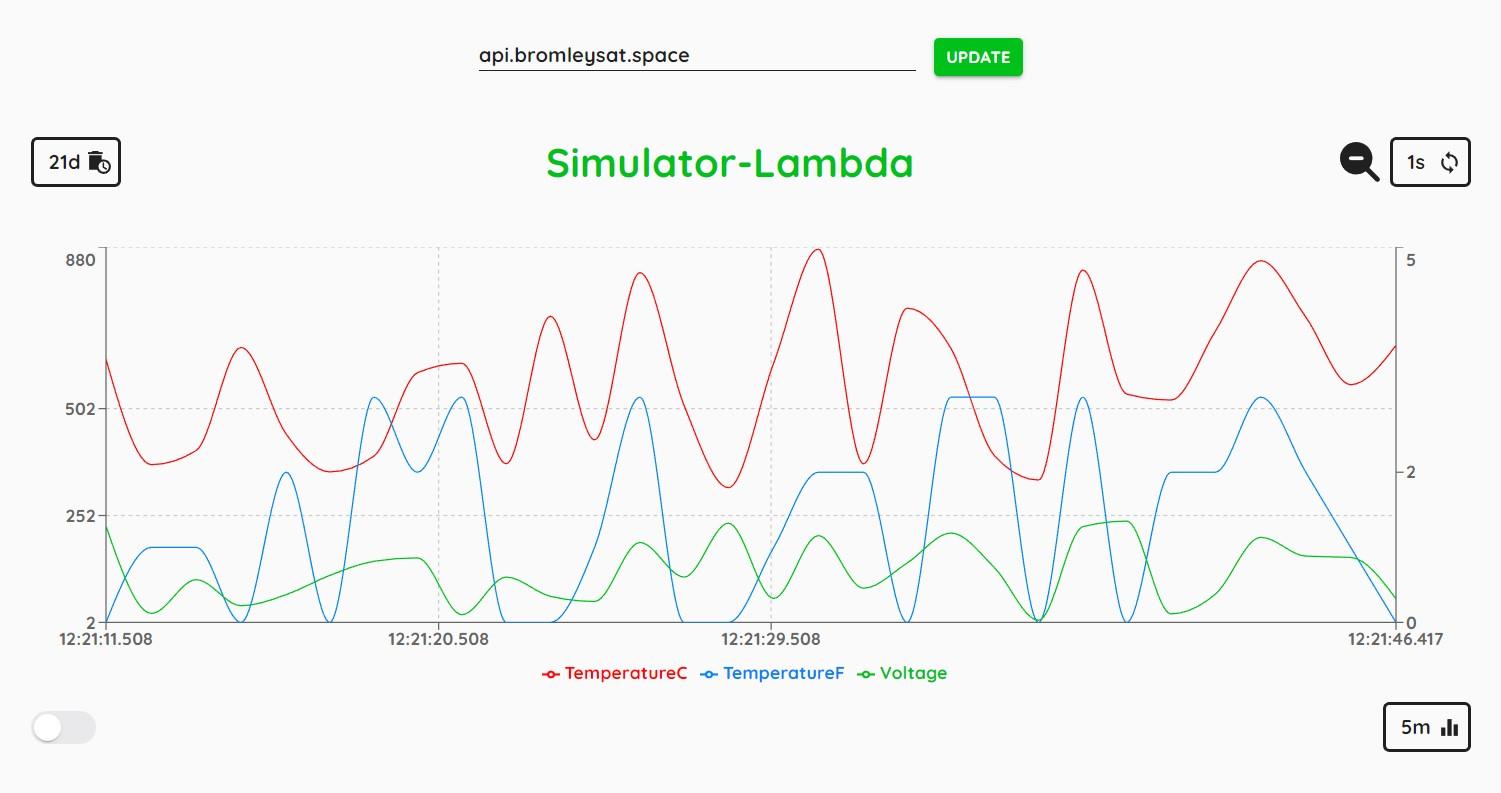
}The below animation illustrates the working process of the Data Plotter:
Getting startedCopy permalink to clipboard
Full simplified example can be found here: https://github.com/BromleySat/data-plotter-example.
Alternatively, you can download the website locally from here: https://bromleysat.space/data/index.html.
And then run it locally:
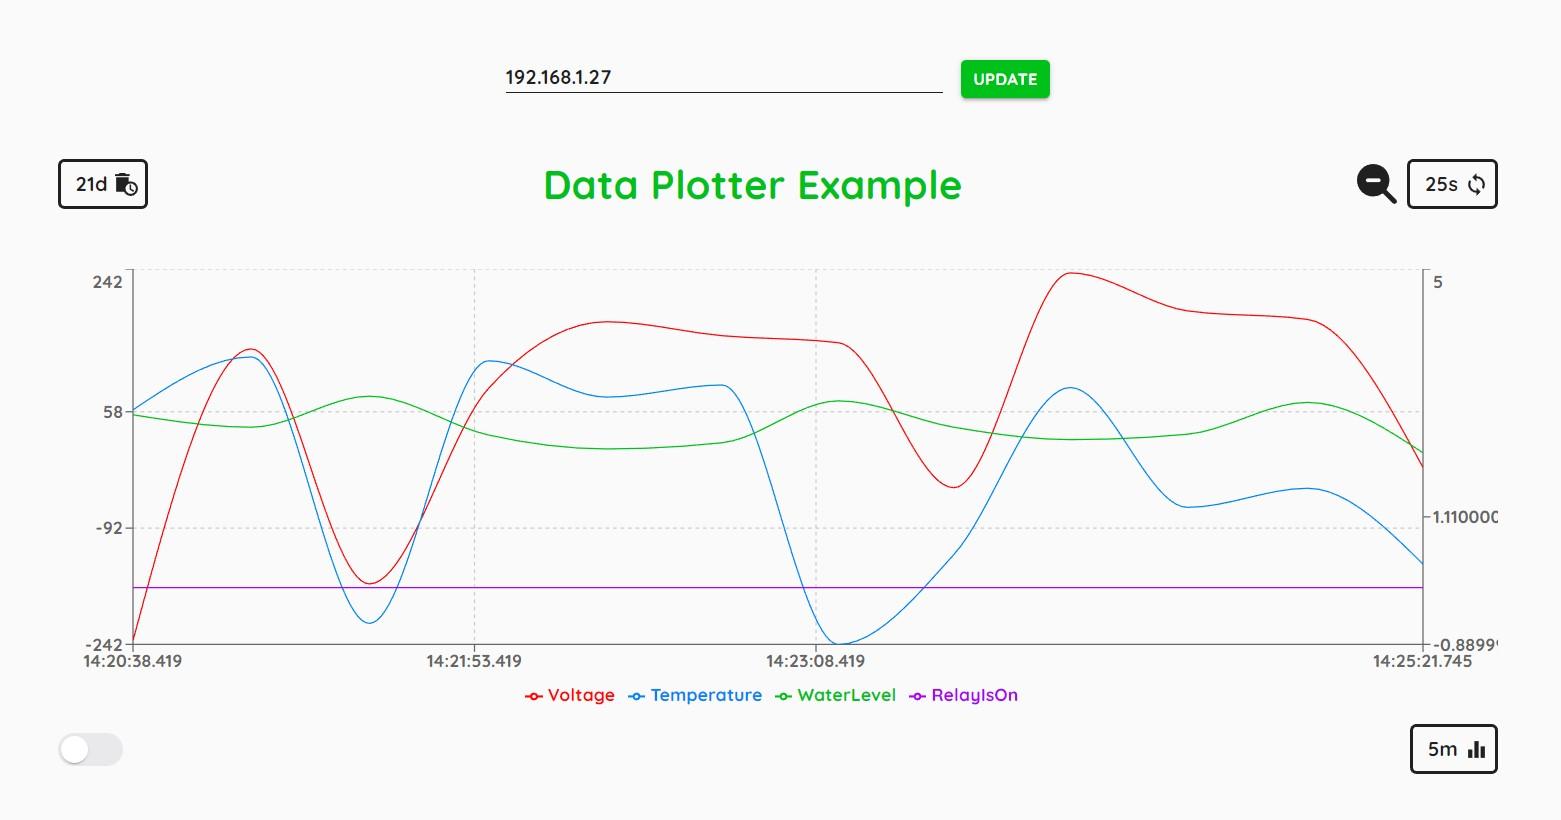
Then specify the local IP of your device and click the UPDATE button:
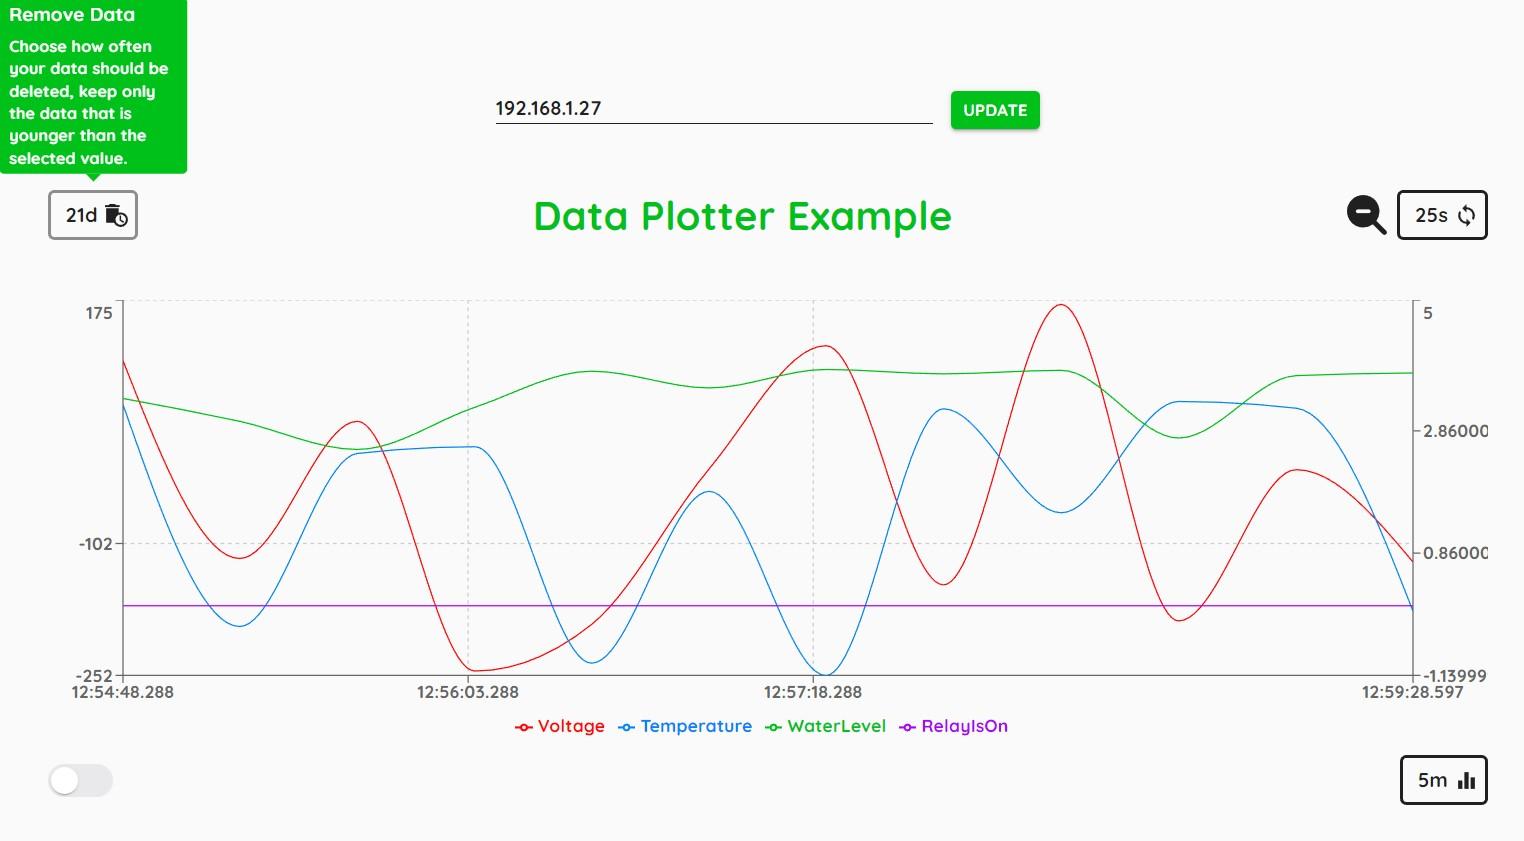
Once your device is connected and you are gathering data, you can adjust your data display and storage configuration based on the available controls:
Remove Data - Choose how often your data should be deleted, keep only the data that is younger than the selected value.
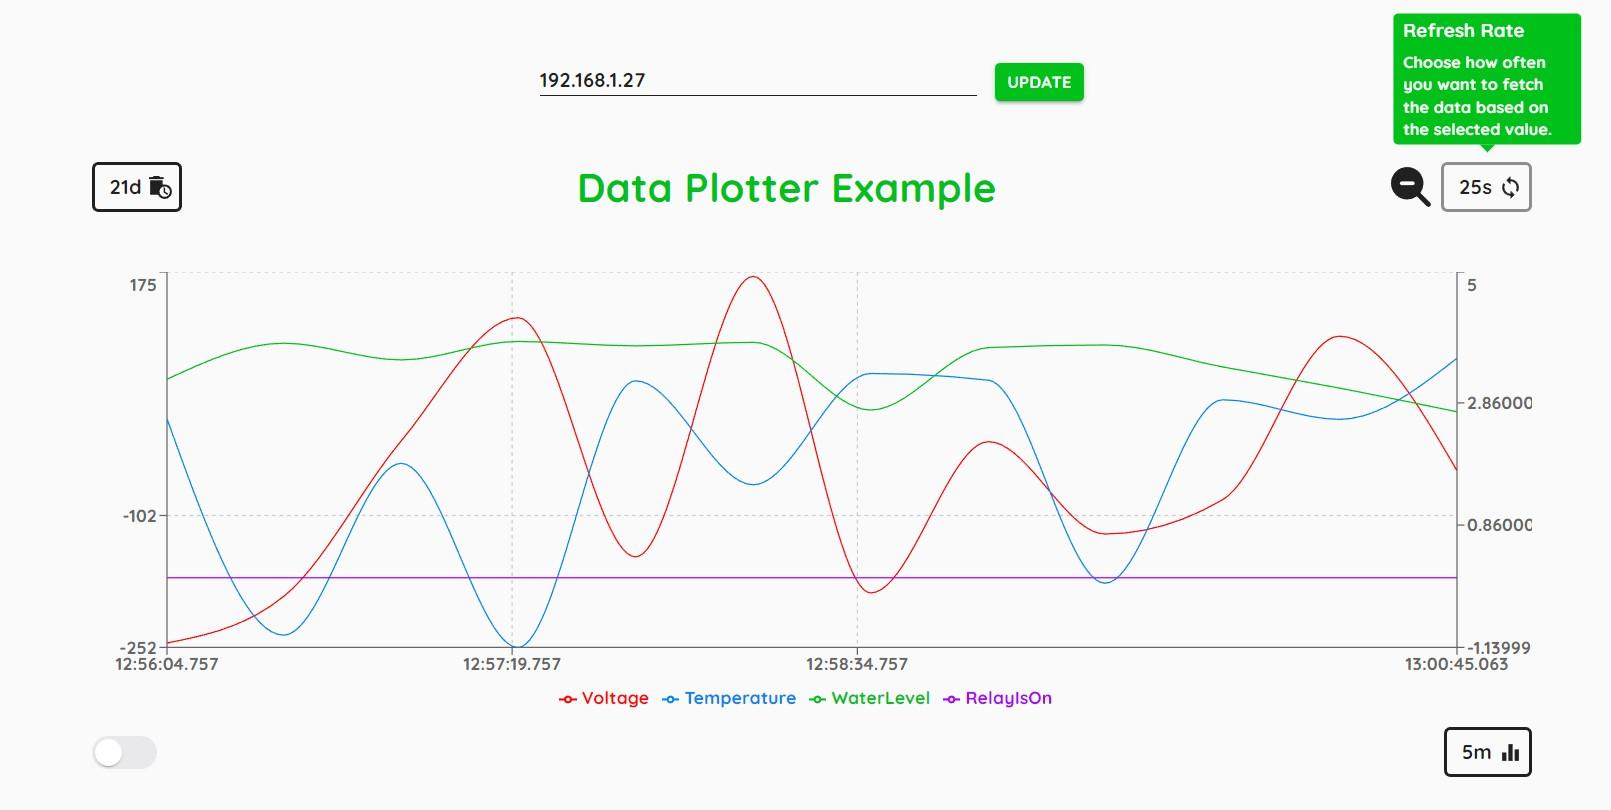
Refresh Rate - Choose how often you want to fetch the data based on the selected value.
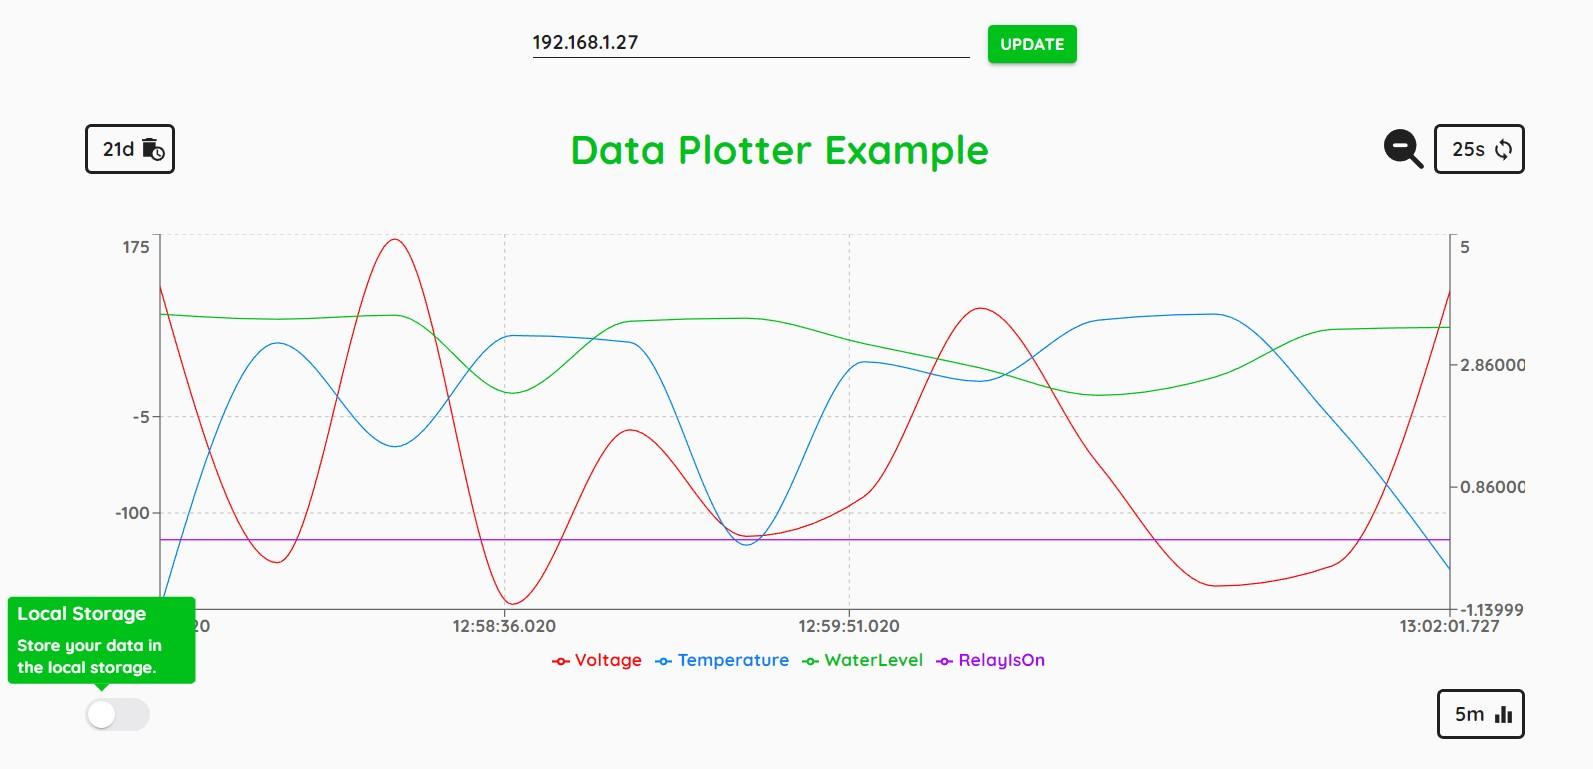
Local Storage - Store your data in the local storage.
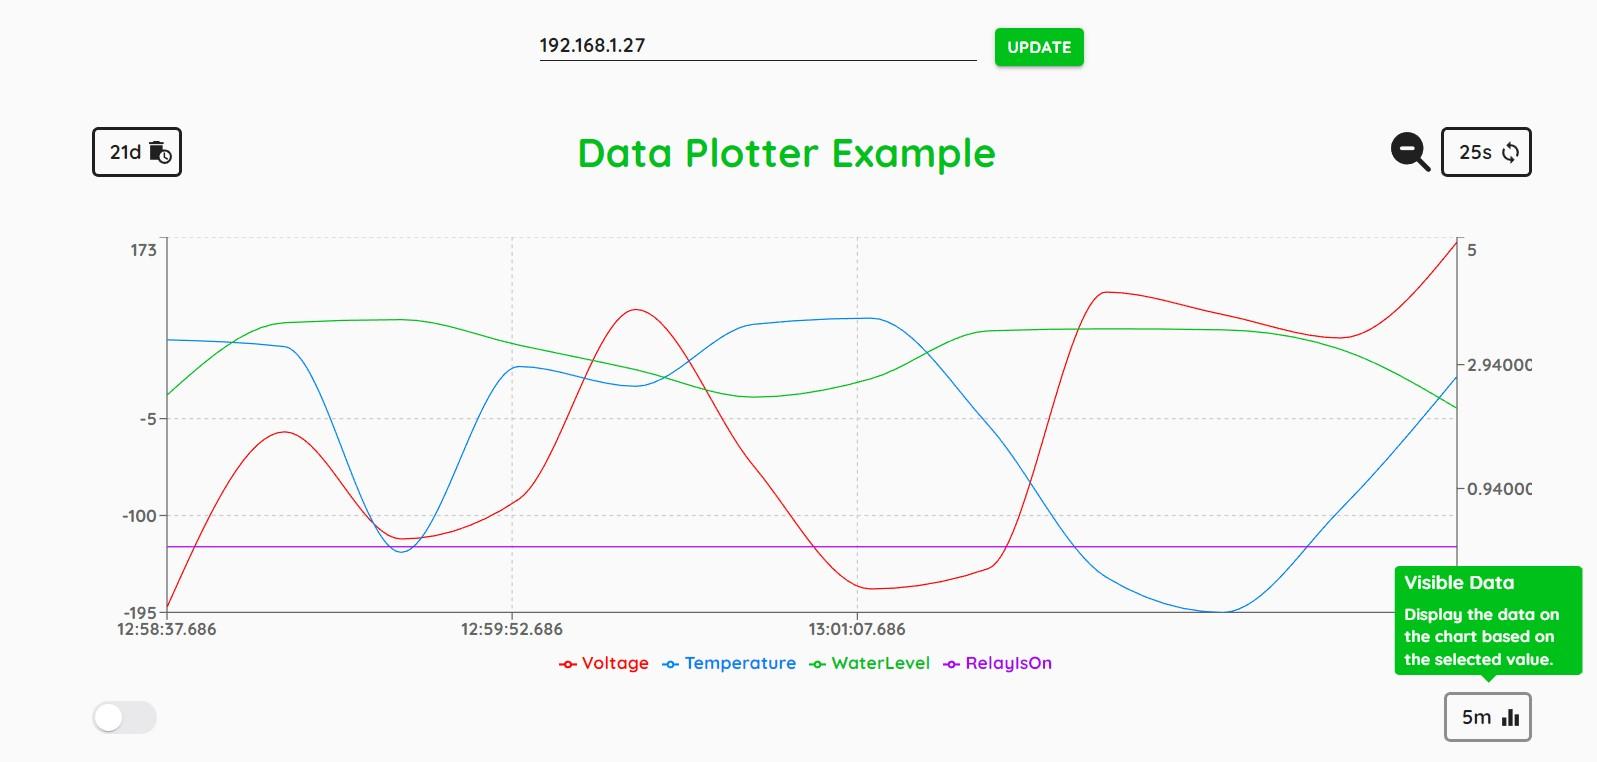
Visible Data - Display the data on the chart based on the selected value.
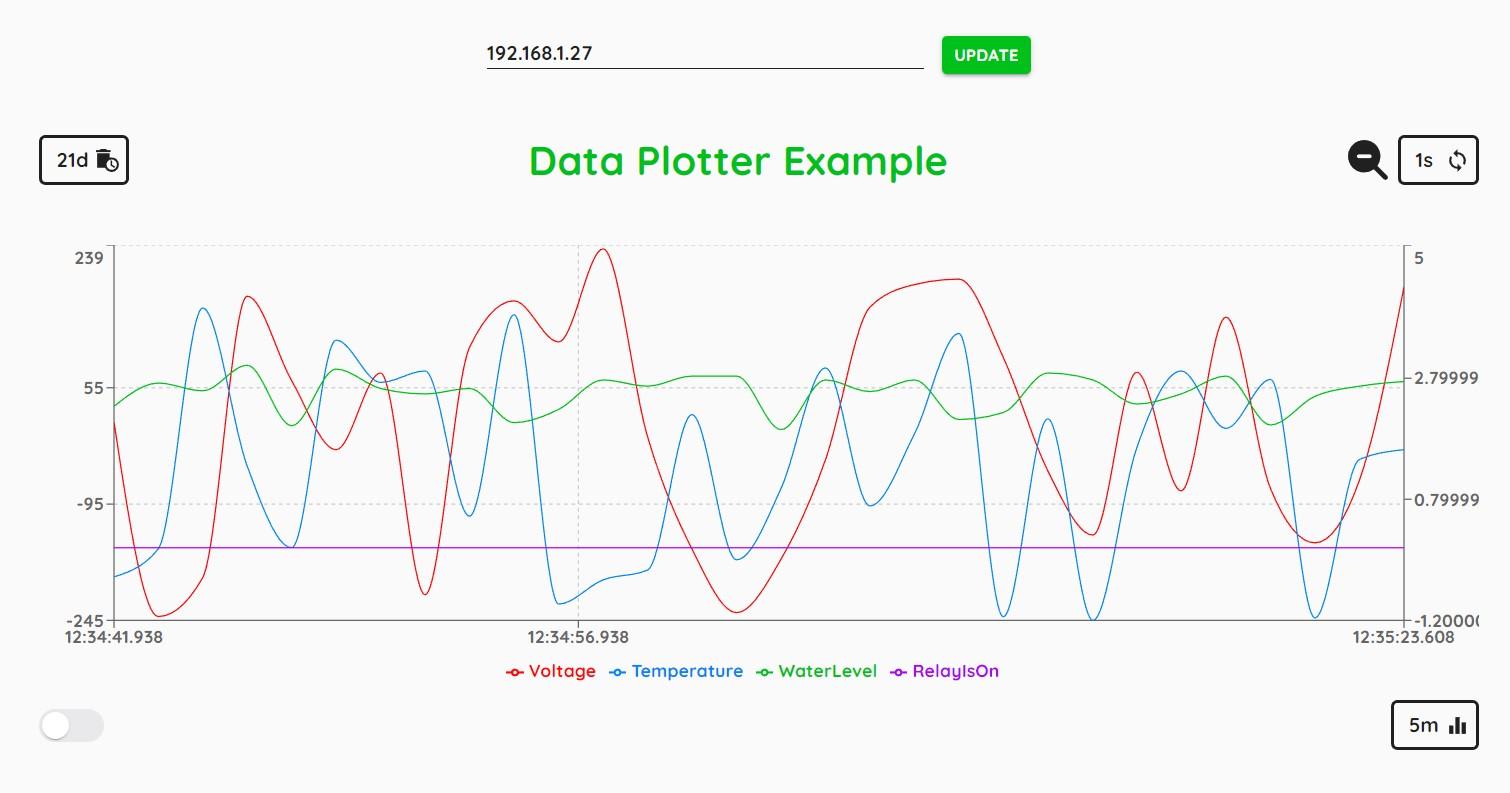
You can also zoom in to any specific area of the chart to focus on that time period:
Once you are done, you can click the Zoom Out button to go back to the normal view:
Wrapping UpCopy permalink to clipboard
This is an article that illustrates how to start using Data Plotter. As mentioned at the beginning of this article Data Plotter is designed to serve a similar function to Arduino IDE’s Serial Plotter. Hopefully you will find it useful.
Thanks for reading.